Project Overview
In this project, I focused on analyzing "performance" data by extracting structured tables from HTML files and generating visualizations for data insights. The process included web scraping, parsing, and creating scatter plots to study correlations among selected variables.
Key Tasks
- Data Parsing: Wrote a script to extract data tables from downloaded HTML files.
- Scatter Plot Visualization: Created two scatter plots with linear regression lines to identify variable correlations.
- Multi-Panel Visualization: Combined the scatter plots into a single figure with two panels.
Tools Used
- Python
- Pandas
- BeautifulSoup (HTML Parsing)
- Matplotlib
- Jupyter Notebook
Sample Visualizations
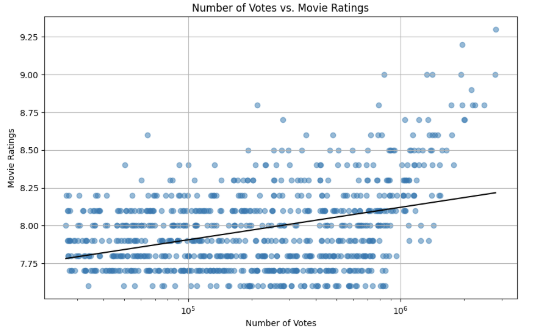
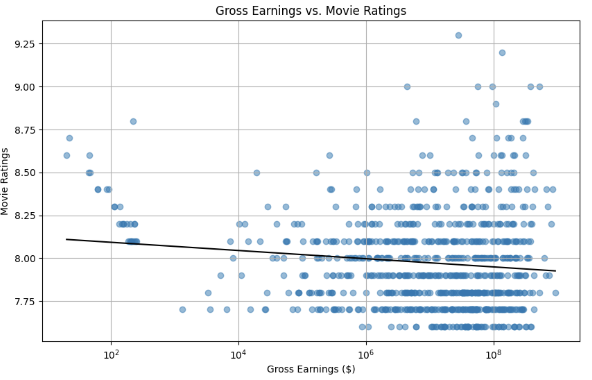
Here are two key visualizations generated in this project:
- Scatter Plot 1: Correlation between Variable X and Variable Y
- Scatter Plot 2: Correlation between Variable A and Variable B
View the Code
Access the Python Notebook and full source code for this project on GitHub:
View on GitHub